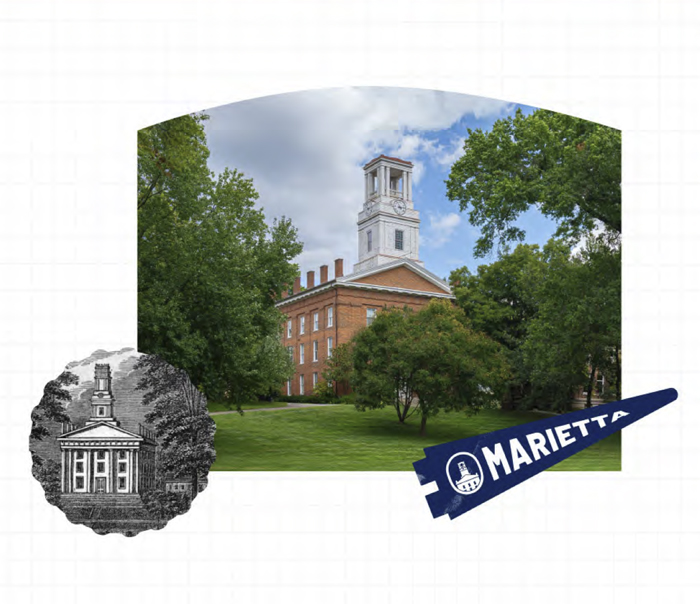
College Type

Private, coeducational, nonsectarian, undergraduate, residential, contemporary liberal arts founded in 1835. One of America's 37 "Revolutionary Colleges," institutions with origins reaching back to the 18th century. Established initially as the Muskingum Academy in 1797.

Enrollment

Total enrollment for the 2023-24 academic year is 1,122 students from 32 states (including Washington, D.C.) and 14 countries.

Campus

The College's picturesque 90-acre campus is in Marietta, Ohio, just two blocks from downtown. The campus includes a state-of-the-art recreation center, planetarium, and library.

Campus Map

Location

Marietta, Ohio (population 13,500), established in 1788 by Revolutionary War veterans led by Gen. Rufus Putnam, is the oldest organized city in the Northwest Territory. Marietta is a river town situated at the confluence of the Ohio and Muskingum rivers. Marietta is part of a much larger Mid-Ohio Valley metropolitan area that includes nearby Parkersburg, West Virginia. This area sustains a combined population of around 133,000. Marietta is only a few hours from Columbus, Cleveland, and Pittsburgh. In 2019, the Travel Channel selected Marietta as the most charming small town in Ohio to visit. Visit Us

Financial Aid

Approximately 82% of students receive need-based financial aid — more than $27 million of Marietta College's funds are committed to financial assistance in the 2023-24 academic year. Learn More

Faculty

Marietta College has 105 faculty members, approximately 82% of whom hold a Ph.D. or terminal degree in their field.

Student-Faculty Ratio

9:1

Average Class Size

12 students

2023-24 Costs

Tuition$37,752
Housing$7,235
Food$5,309
Fees$1,122
Freshmen Orientation Fee$400

Total Standard Cost:$51,418

*Additional meal plans and housing options are available, which may increase or decrease a student's total cost from the standard rates above.

Net Price Calculator
To obtain an estimate of what your family will pay if you choose to attend Marietta College, use our Net Price Calculator. This Net Price Calculator is designed to estimate the costs for first-time freshmen from the U.S.A. who are enrolled full-time and living on-campus. If you have questions about the calculator for affording a Marietta education, please contact our Student Financial Services Office at 740.376.4712 or 800.331.2709 or by email at finaid@marietta.edu.

Academic Programs

Marietta offers more than 50 undergraduate majors. Programs include leadership, petroleum engineering, fine arts, sciences, athletic training, education, and music therapy. Students have boundless opportunities for field experience, professional internships, and study abroad. Learn More

Academic Legacy

Chartered in 1860, the Marietta College chapter of Phi Beta Kappa is the 16th oldest in the nation.

Academic Calendar

Two semesters (fall & spring) and a summer session. Learn More

Graduate Studies

More than 80 students are working on master's degrees in either Athletic Training, Physician Assistant Studies, or Psychology.

Admission Profile

  • Percentage of applicants accepted: 75.9%
  • Average ACT score for an admitted student: 21.3
  • Average SAT score for an admitted student: 1035
  • Undergraduate application deadline: Early Action and Rolling Admission
  • Apply

College Mission

Marietta College provides a strong foundation for a lifetime of leadership, critical thinking, and problem-solving. We achieve this mission by offering undergraduates a contemporary liberal arts education and graduate students an education grounded in advanced knowledge and professional practice. Intellectual and creative excellence defines the Marietta experience. Learn More

Statement of Nondiscrimination

Marietta College admits students of any race, color, national or ethnic origin, disability, gender orientation, or religious affiliation to all rights, privileges, programs, and activities generally accorded or made available to students at the school. It does not discriminate on the basis of race, color, national or ethnic origin, disability, gender orientation, or religious affiliation in the administration of its educational policies, admissions policies, scholarships and loan programs, and athletic and other college-administrated programs. If you have any questions regarding our non-discrimination policy, please get in touch with Marietta College’s Office of Human Resources.

President

Margaret L. Drugovich

President's Cabinet

Recognition

U.S. News & World Report, "Best in the Midwest"
No. 7 in the Nation on the New York Times-Brookings Institution's "Common Sense Rankings" in 2015
No. 19 in the Nation for Contribution to the Public Good (Washington Monthly) in 2023
No. 3 in Ohio for Salary Impact (Wall Street Journal/College Pulse) in 2024

Accreditation

The College is accredited by the Higher Learning Commission and is a member of the North Central Association.

Please review Marietta College's Assurance Argument to the HLC (2015).

Alumni

25,000

Alma Mater

The Navy Blue and White

Athletics

  • NCAA Division III and Ohio Athletic Conference
  • 23 varsity sports and nearly 500 student-athletes
  • Baseball (M), Basketball (M/W), Cross Country (M/W), Esports (Coed), Football (M), Golf (M/W), Lacrosse (M/W), Rowing (M/W), Soccer (M/W), Softball (W), Tennis (M/W), Indoor Track and Field (M/W), Outdoor Track and Field (M/W) and Volleyball (W).
  • Learn More

School Colors

Navy Blue & White

Athletics Mascot

Pioneers

Fall 2023 Profile

Faculty

  • Full-time faculty: 105
  • Part-time faculty: 72
  • Total: 177

Undergraduate enrollment

  • Full-time students: 1,019
  • Part-time students: 66
  • Total: 1,085
  • FTE: 1,041

Graduate enrollment

  • Full-time: 80
  • Part-Time: 6
  • Total: 86
  • FTE: 82

Incoming First-Year Students

  • Women: 45.6%
  • Men: 54.4%
  • Diverse students of color: 14.8%
  • Average SAT for first-year students: 1128
  • Average ACT for first-year students: 21.6
  • Average high school GPA for first-year students: 3.89

Top U.S. Geographic Regions Represented for Traditional Students

  • From Ohio: 73.5%
  • From West Virginia: 8.7%
  • Great Lakes states other than Ohio (Illinois, Indiana, Michigan, Pennsylvania): 6.8%
  • New England/Mid-Atlantic (Massachusetts, Maryland, New Jersey, New York): 2.6%
  • Southeast (Alabama, Florida, Georgia, Kentucky, North Carolina, Virginia): 6.8%
  • All Other States/Regions: 1.6%